Concept · Code-first design system & prototype
Field Guide
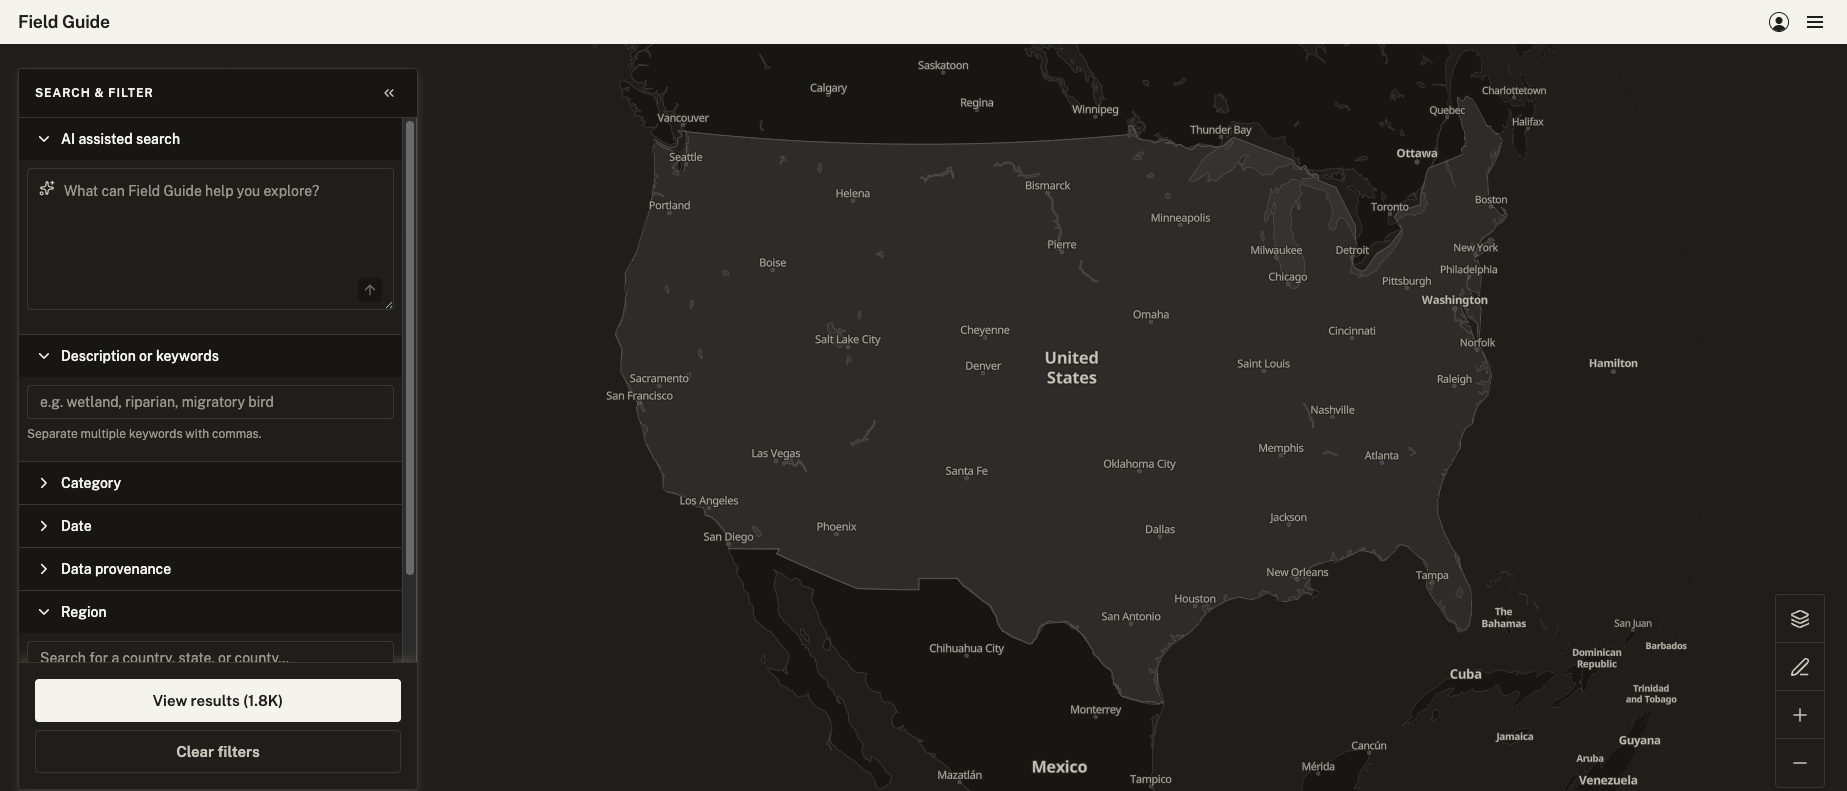
Field ecology and conservation data is produced by dozens of separate agencies, federal, state, and county, each with its own schema and its own conventions. Field Guide is a design system and interactive prototype exploring how that fragmented data could be reconciled into one coherent, trustworthy view, tested against real datasets from GBIF, USGS, and Washington State wildlife agencies.
Problem
Field ecology and conservation data is produced by dozens of separate agencies, federal, state, and county, each with its own schema and its own conventions for even simple values like date or species. A researcher trying to answer a cross-jurisdictional question today has to know which agencies to check, request or download from each separately, and reconcile the differences by hand.
Field Guide started as a speculative concept, tested against real data: actual field inventories from GBIF, USGS's Protected Areas Database, and Washington State wildlife data. That research surfaced genuine structural conflicts: mismatched geometry types, inconsistent date semantics, and status fields that meant different things to different agencies. It also confirmed that USGS and WDFW already maintained informal "crosswalks" to cope with exactly this problem internally.
The design system had parallel ambitions: reconcile the data itself, as well as the visual noise around it. Every agency uses its own branding, formatting conventions, and visual hierarchy; none of it designed to sit next to another agency's in the same view. Field Guide needed a visual language confident enough to stand on its own, and familiar enough that a user versed in government data products would recognize its logic on sight. The structural discipline of the National Park Service's Unigrid system, and the restrained, functional palettes of agencies like USGS and NOAA, shaped the thinking.
System Concept
One schema, not one format. Field Guide organizes around a shared, unifying schema that groups matching concepts together like provenance, time, or geography, while leaving each source's more specific, unmatched details intact. The result consolidates what's genuinely comparable across agencies without pretending two different things are the same just because they landed in the same field.
Search that meets people where they already work. A field researcher may know exactly which taxon, agency, and date range they need. A congressional staffer on a summer internship may only know the general shape of what they're looking for. I designed Field Guide to support both with the same toolset. AI-assisted search would help either persona find the right terms and surface sources they wouldn't have known to check, while faceted search provides familiar structure to a targeted query. Research into existing biodiversity databases like GBIF, iDigBio, and eBird confirmed that faceted filtering, not a query language, is how domain experts in this space already search.
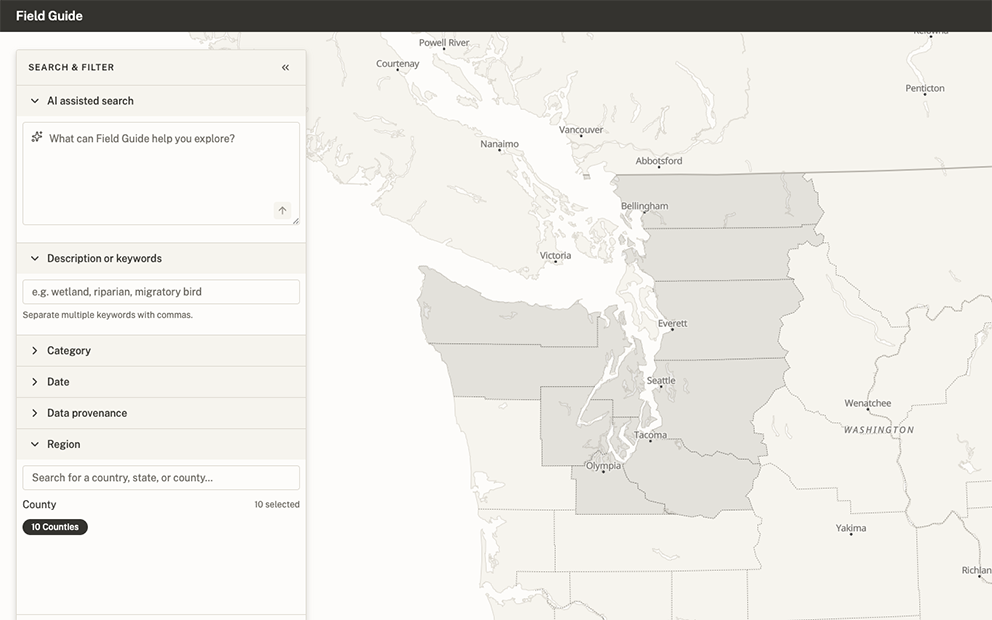
Geography as a first-class filter, not an afterthought. Ecological data doesn't respect administrative lines. A species range, a watershed, a mountain range — the natural zones that actually matter to a search rarely line up with state or county borders, but government data is organized by exactly those borders. Field Guide's Region filter lets a search be specified by real jurisdiction, letting results narrow to the geography that actually matters faster and more precisely than working through unrelated terrain would.
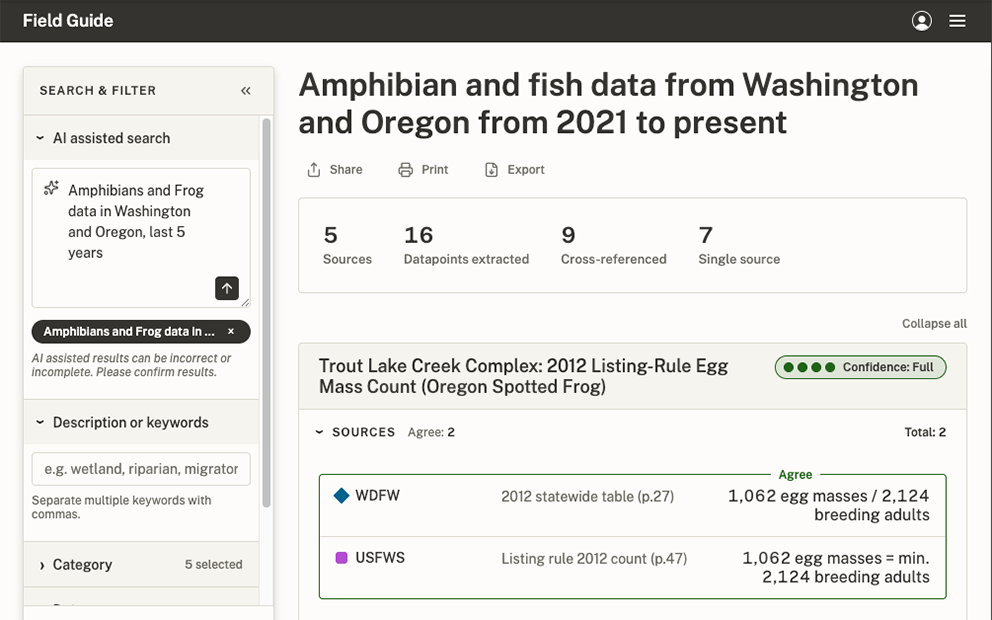
Showing agreement and disagreement with transparency. Conflicting data can be just as informative as agreeing data. I designed Field Guide's results to organize sources without distorting what they actually say, so a user can see commonality even when sources don't concur. Derived values from multiple sources are paired with their verbatim references and scored for agreement on a gradient: full agreement, partial alignment, divergence, or outright conflict. Where two sources disagree on a figure, the interface shows that conflict instead of resolving it.
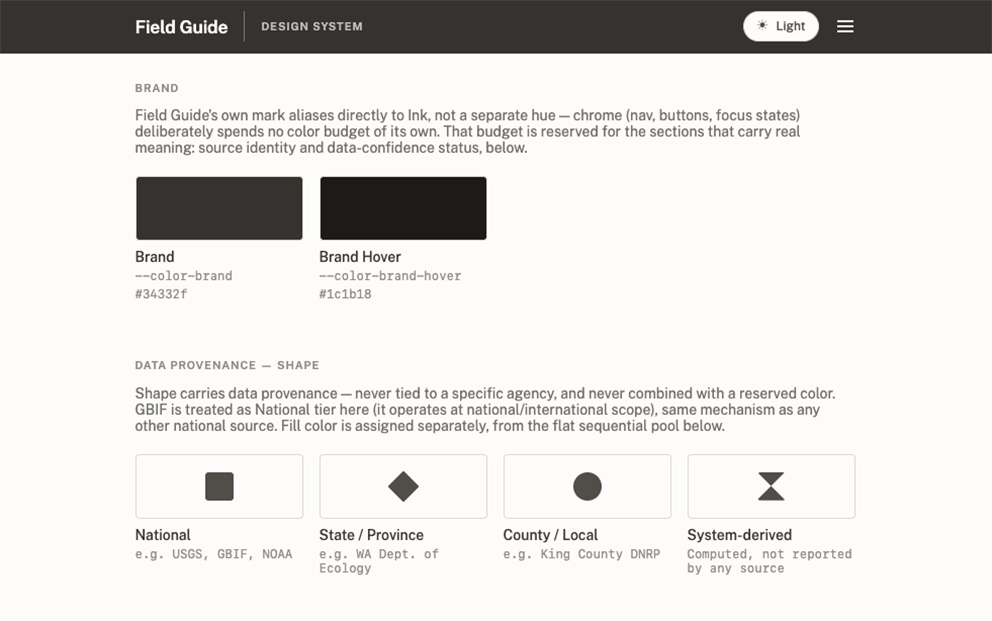
Provenance all the way down. Knowing where data comes from matters as much as the data itself, so provenance needed to be visible at a glance. I built the source-identity system around accessibility from the start: shape encodes jurisdiction (square for national, diamond for state, circle for county), so tier is legible independent of color, and color distinguishes individual sources within a tier, validated for colorblind-safe separation. Some shapes were ruled out early, since they risked reading as a trend or status indicators rather than a neutral jurisdiction marker.
Process
Grounding the concept. I started this project wanting to help science, research, and policy work better, and looked for where that ambition kept breaking down in practice. Agency data fragmentation turned up quickly as a documented problem, described in papers like Paloniemi, Tikka, and Haila's 2012 piece, "Fragmented Biodiversity Governance: A Barrier to Effective Conservation." I recognized the shape of it from my own background designing for eDiscovery, where data forensics and reconciliation is the whole job. That overlap told me the potential user base was broader than researchers alone; anyone doing cross-source reconciliation under time pressure would recognize it.
Building the design system code-first. With this project, I successfully challenged myself to complete the work without ever touching a design tool like Figma. The design system needed a critical mass of tokens, components, and conventions before the actual product experience design could start. I expected it would keep evolving once real application put pressure on it. Setting out with an accessibility-centered foundation made iteration more efficient, and gave me and the agents guiding principles to expand the system with.
"No plan survives contact with the enemy." A flexible, code-first system meant problems could be met head-on instead of wireframed around exhaustively in advance. Data Provenance and Region were built as one interaction, then design testing revealed they were quietly answering two different questions, who published a source and what geography it covered, as if they were one. I unpacked the conflation, reasoned through the actual distinction, and rebuilt it as two independent filters. Catching and correcting that in working code was faster than a low-fidelity pass would have been at guessing the same problem in the abstract.
Directing AI-assisted design and development. For this project I ran two AI agents in tandem. The first helped organize, research and rationalize decisions in conversation before converting them into prompts. I also used this agent to queue and batch tasks strategically. The other executed against those precise, scoped prompts, consistently capturing documentation and process hygiene. A virtuous circle of human to AI organization, AI to AI execution, then AI back to human verification and finesse, formed a repeatable loop: decisions got sharper before they were built, execution stayed consistent, and every result was checked before the next decision built on top of it.
Grounding the data in reality. Field Guide is a hypothetical design system built to support a speculative product, and with that much invention already in play, I wanted to hew to as much veracity as I could to shape both the product and the system honestly. Entities became real, researched federal and state agencies. Sample data became real figures pulled from government reports, including a genuine conflict between two agencies' own numbers. Grounding the fiction in real material kept the design decisions honest and informed. A system built to reconcile real disagreement needed real disagreement to prove it worked. This philosophy was applied continuously throughout the build.
Knowing when to stop. Every medium has limitations. Figma had them; a lightweight, locally-coded, autonomous prototype has different ones, and staying clear-eyed about them keeps prototypes practical and scoped. One feature, letting the map's colors react live to a theme switch, took three separate attempts across a single session, each one introducing a new visual regression. I chose to stop rather than keep pushing: this is a prototype demonstrating a design system, not the shipped product itself, and a documented, intentional limitation (a manual refresh) was a better outcome than an unstable feature. Choosing and documenting scope like this, deliberately, was part of the same discipline as building the system in the first place.
Open Questions
Expanding beyond U.S. agencies. The Data Provenance shape system (National, State, County) is built around a single country's jurisdictional structure. Adding another country's agencies raises a real design question before it's just more data: does the shape system need a tier above National, and does nesting even work the same way outside a federal system like the U.S.'s?
Including academic and other non-government sources. The prototype deliberately excluded peer-reviewed and unpublished academic work, since the existing tier system has no honest place for them. They're not National, State, or County. Including them for real would mean extending the provenance vocabulary, not just adding more entries to the existing one.
Real data at true national scale. County-level sourcing stayed real for two deep-dive states and templated everywhere else, a deliberate scope boundary for a prototype. Extending real research to all three thousand U.S. counties would take a fundamentally different data pipeline than hand-verifying two states.
How much interpretive latitude AI-assisted search should have. A user asking for "all of Washington except King County" is asking for real nuance the current flat selection model can't represent. Deciding how much of that judgment belongs to the system versus the user is a genuine open design question, not just an engineering one.
Outcome & Reflection
Field Guide is a confident first draft of a design system, built to serve a real, researched user need, and a testable prototype environment that could inform a whole new product suite. The value ran in both directions. The design system shaped what the product could become, and building the product against real scenarios kept surfacing what the system still needed. This recursive validation made it so the system isn't finished because the product is done. It's more finished because the product tested it.
Working with multiple agents in tandem changed the tempo of work and what I chose to spend attention on. The process itself: plan, execute, queue changes, review, repeat, helped make decisions deliberate and informed. A detail that never got flagged wasn't overlooked. It passed through the same review and simply didn't need to be changed. The ones I did stop for, a specific corner radius, or color relationship, were intentional because everything else wasn't competing for that same attention.
In this project I also came to a new partnership with the code and a different appreciation for engineers. I can review it, and reason about whether it's doing what I intended, and I know my limits. A skilled engineer could know if it was built securely and correctly. It points at something bigger: a fully coded design system, running inside a stable sandbox that behaves like real production, will put a lot of ordinary product work on rails, checked rather than reinvented, freeing both design and engineering to spend real effort on what's genuinely novel instead.
There's more here than what shipped. A next pass is already taking shape in my head, not because this one fell short, but because a system this alive keeps generating its own next questions.
A system this alive keeps generating its own next questions.